Investigate before you invest.

Every stock gets graded against three gates — can it survive, is it growing, is the price fair — each scored 0-100 from fundamentals alone: filed financials and analyst consensus, no hype, no headlines. Every score traces straight back to the filing.

100 founders unlock the full data license — for everyone. Your founding rate never goes up for as long as you stay a member, and your name goes on the founders wall. Founders get first access when the campaign opens.

See the product ↓ or create a free account

Tour the product

Real screens from the live app — shown in the founders’ gold theme.

Screener

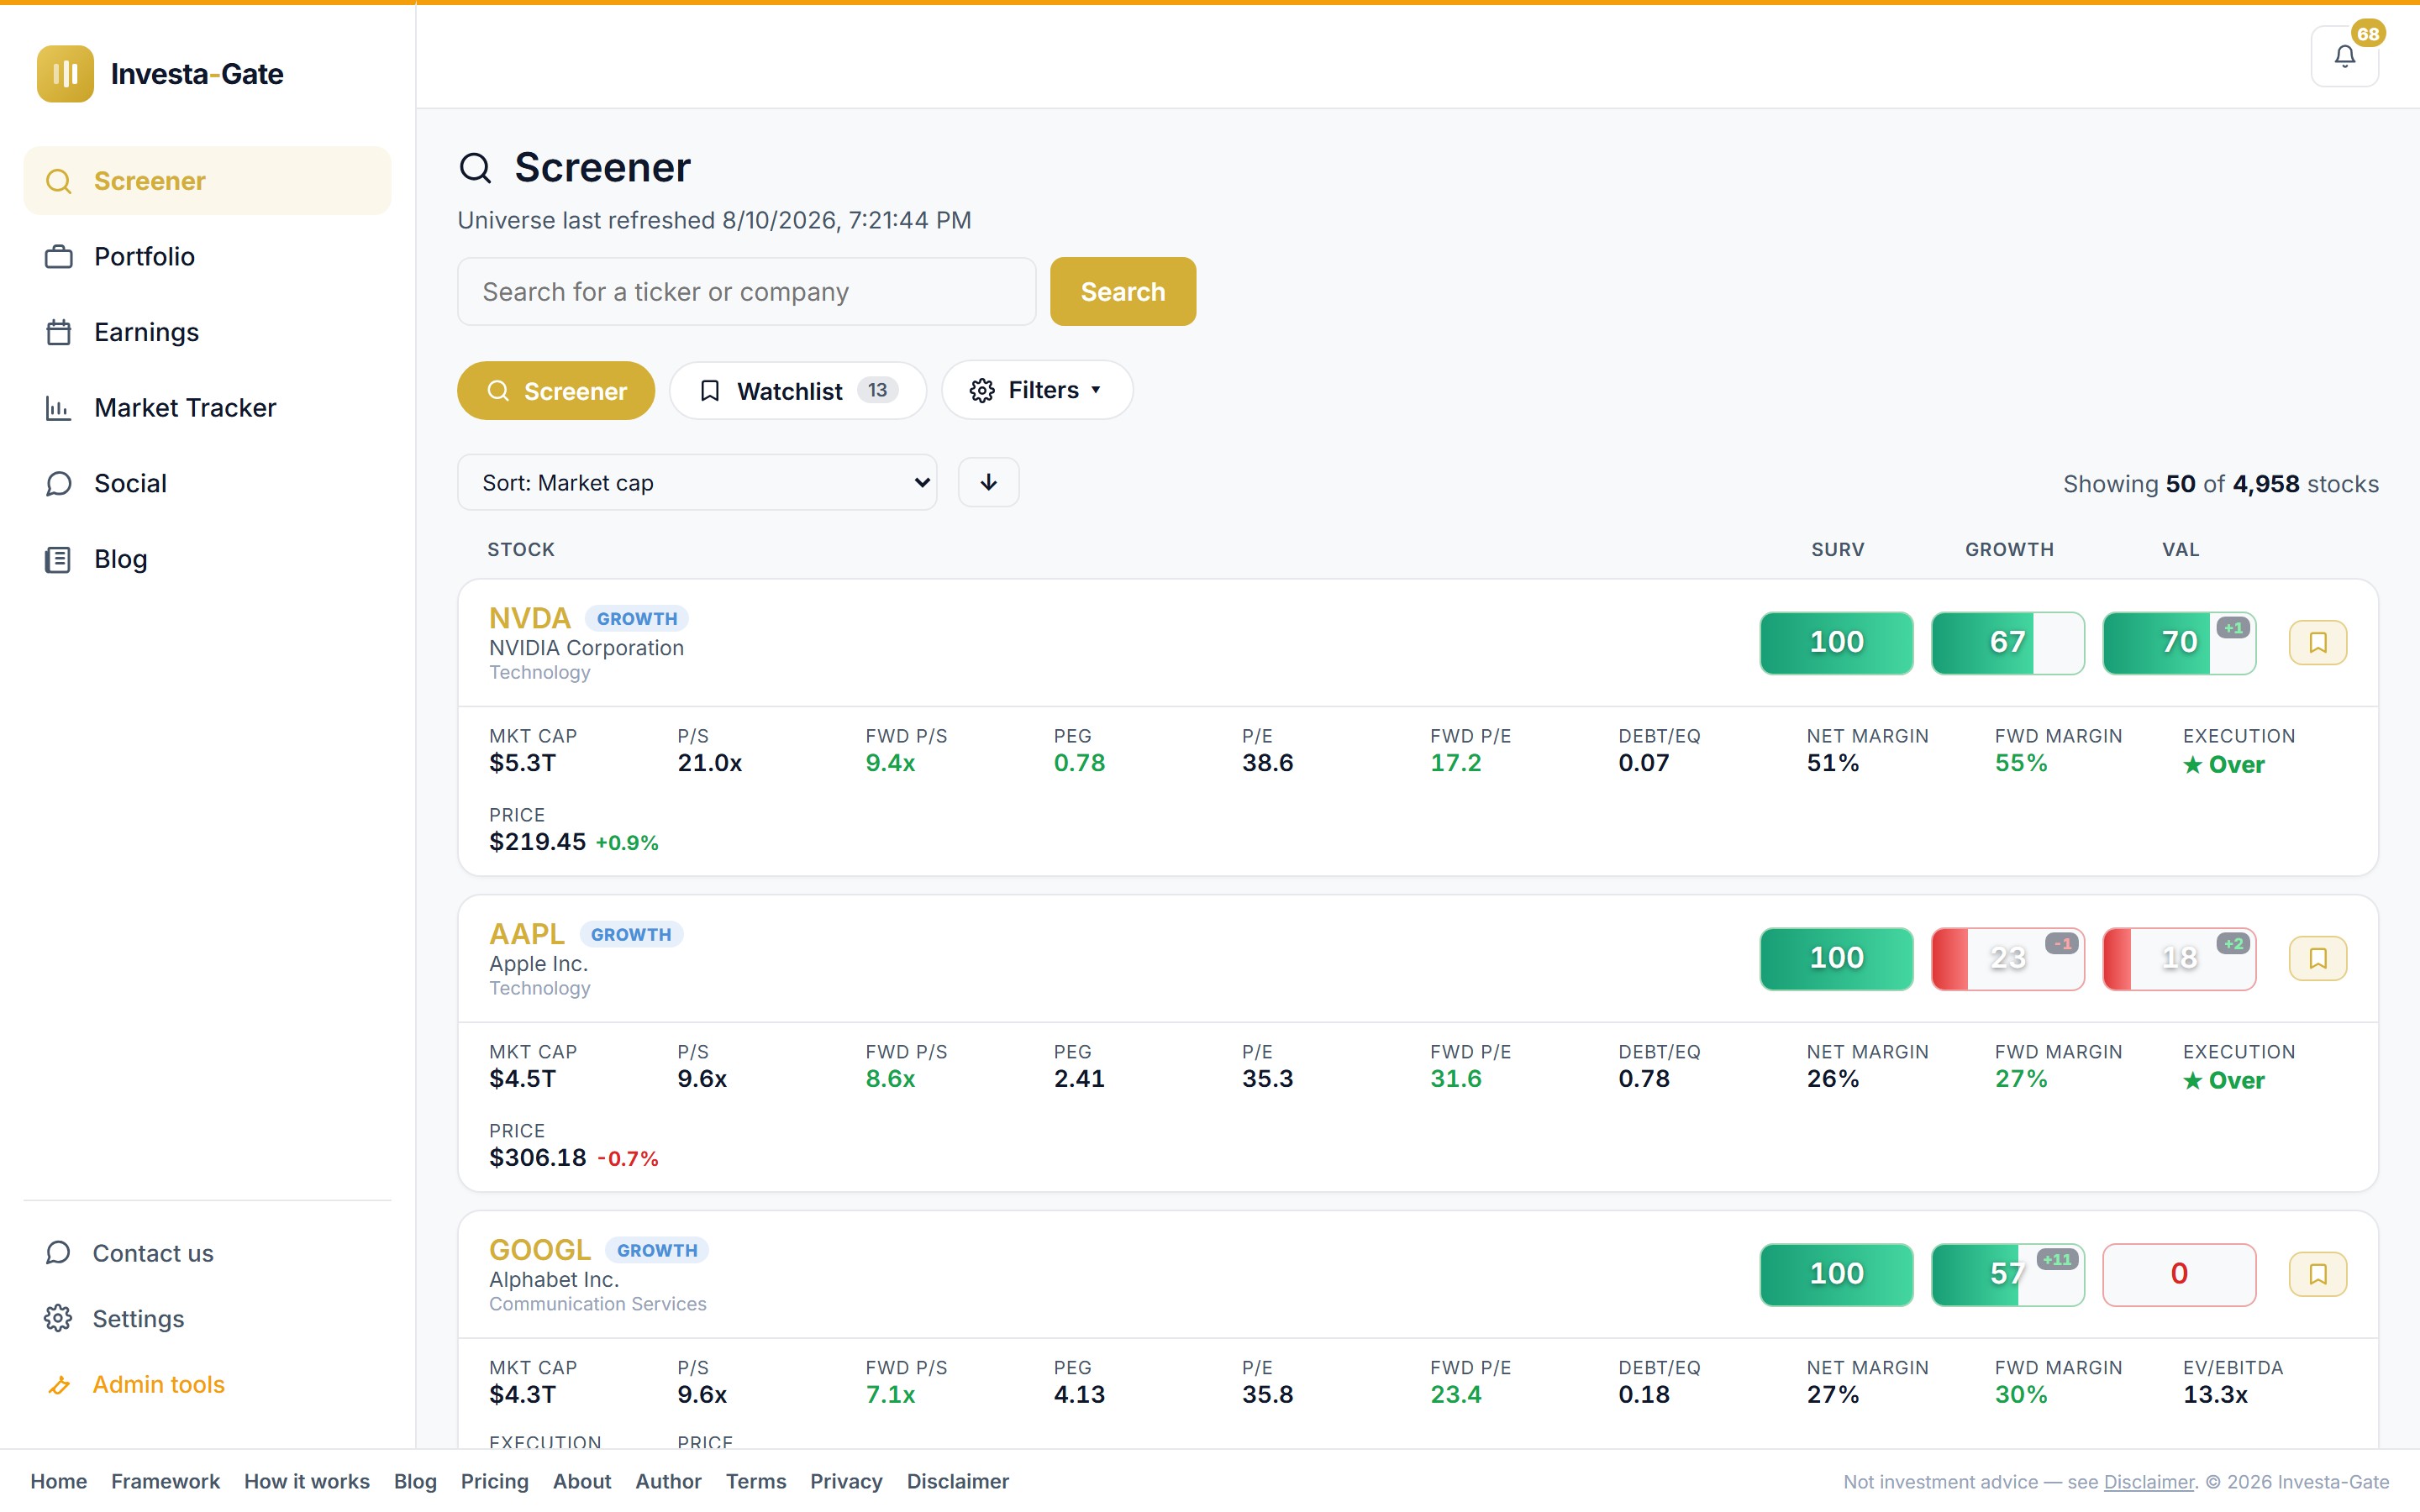
Every US stock, graded — no exceptions, no favorites

All ~4,900 US-listed stocks scored nightly through three gates — Survival, Growth, and Valuation, each 0-100. The scores are computed from fundamentals alone: filed financials and analyst consensus, never news or hype. The engine has opinions: it will happily hand the biggest name on the market a failing grade when the numbers say so.
Screener — screen 1 of 2Screener — screen 2 of 2
Ticker page

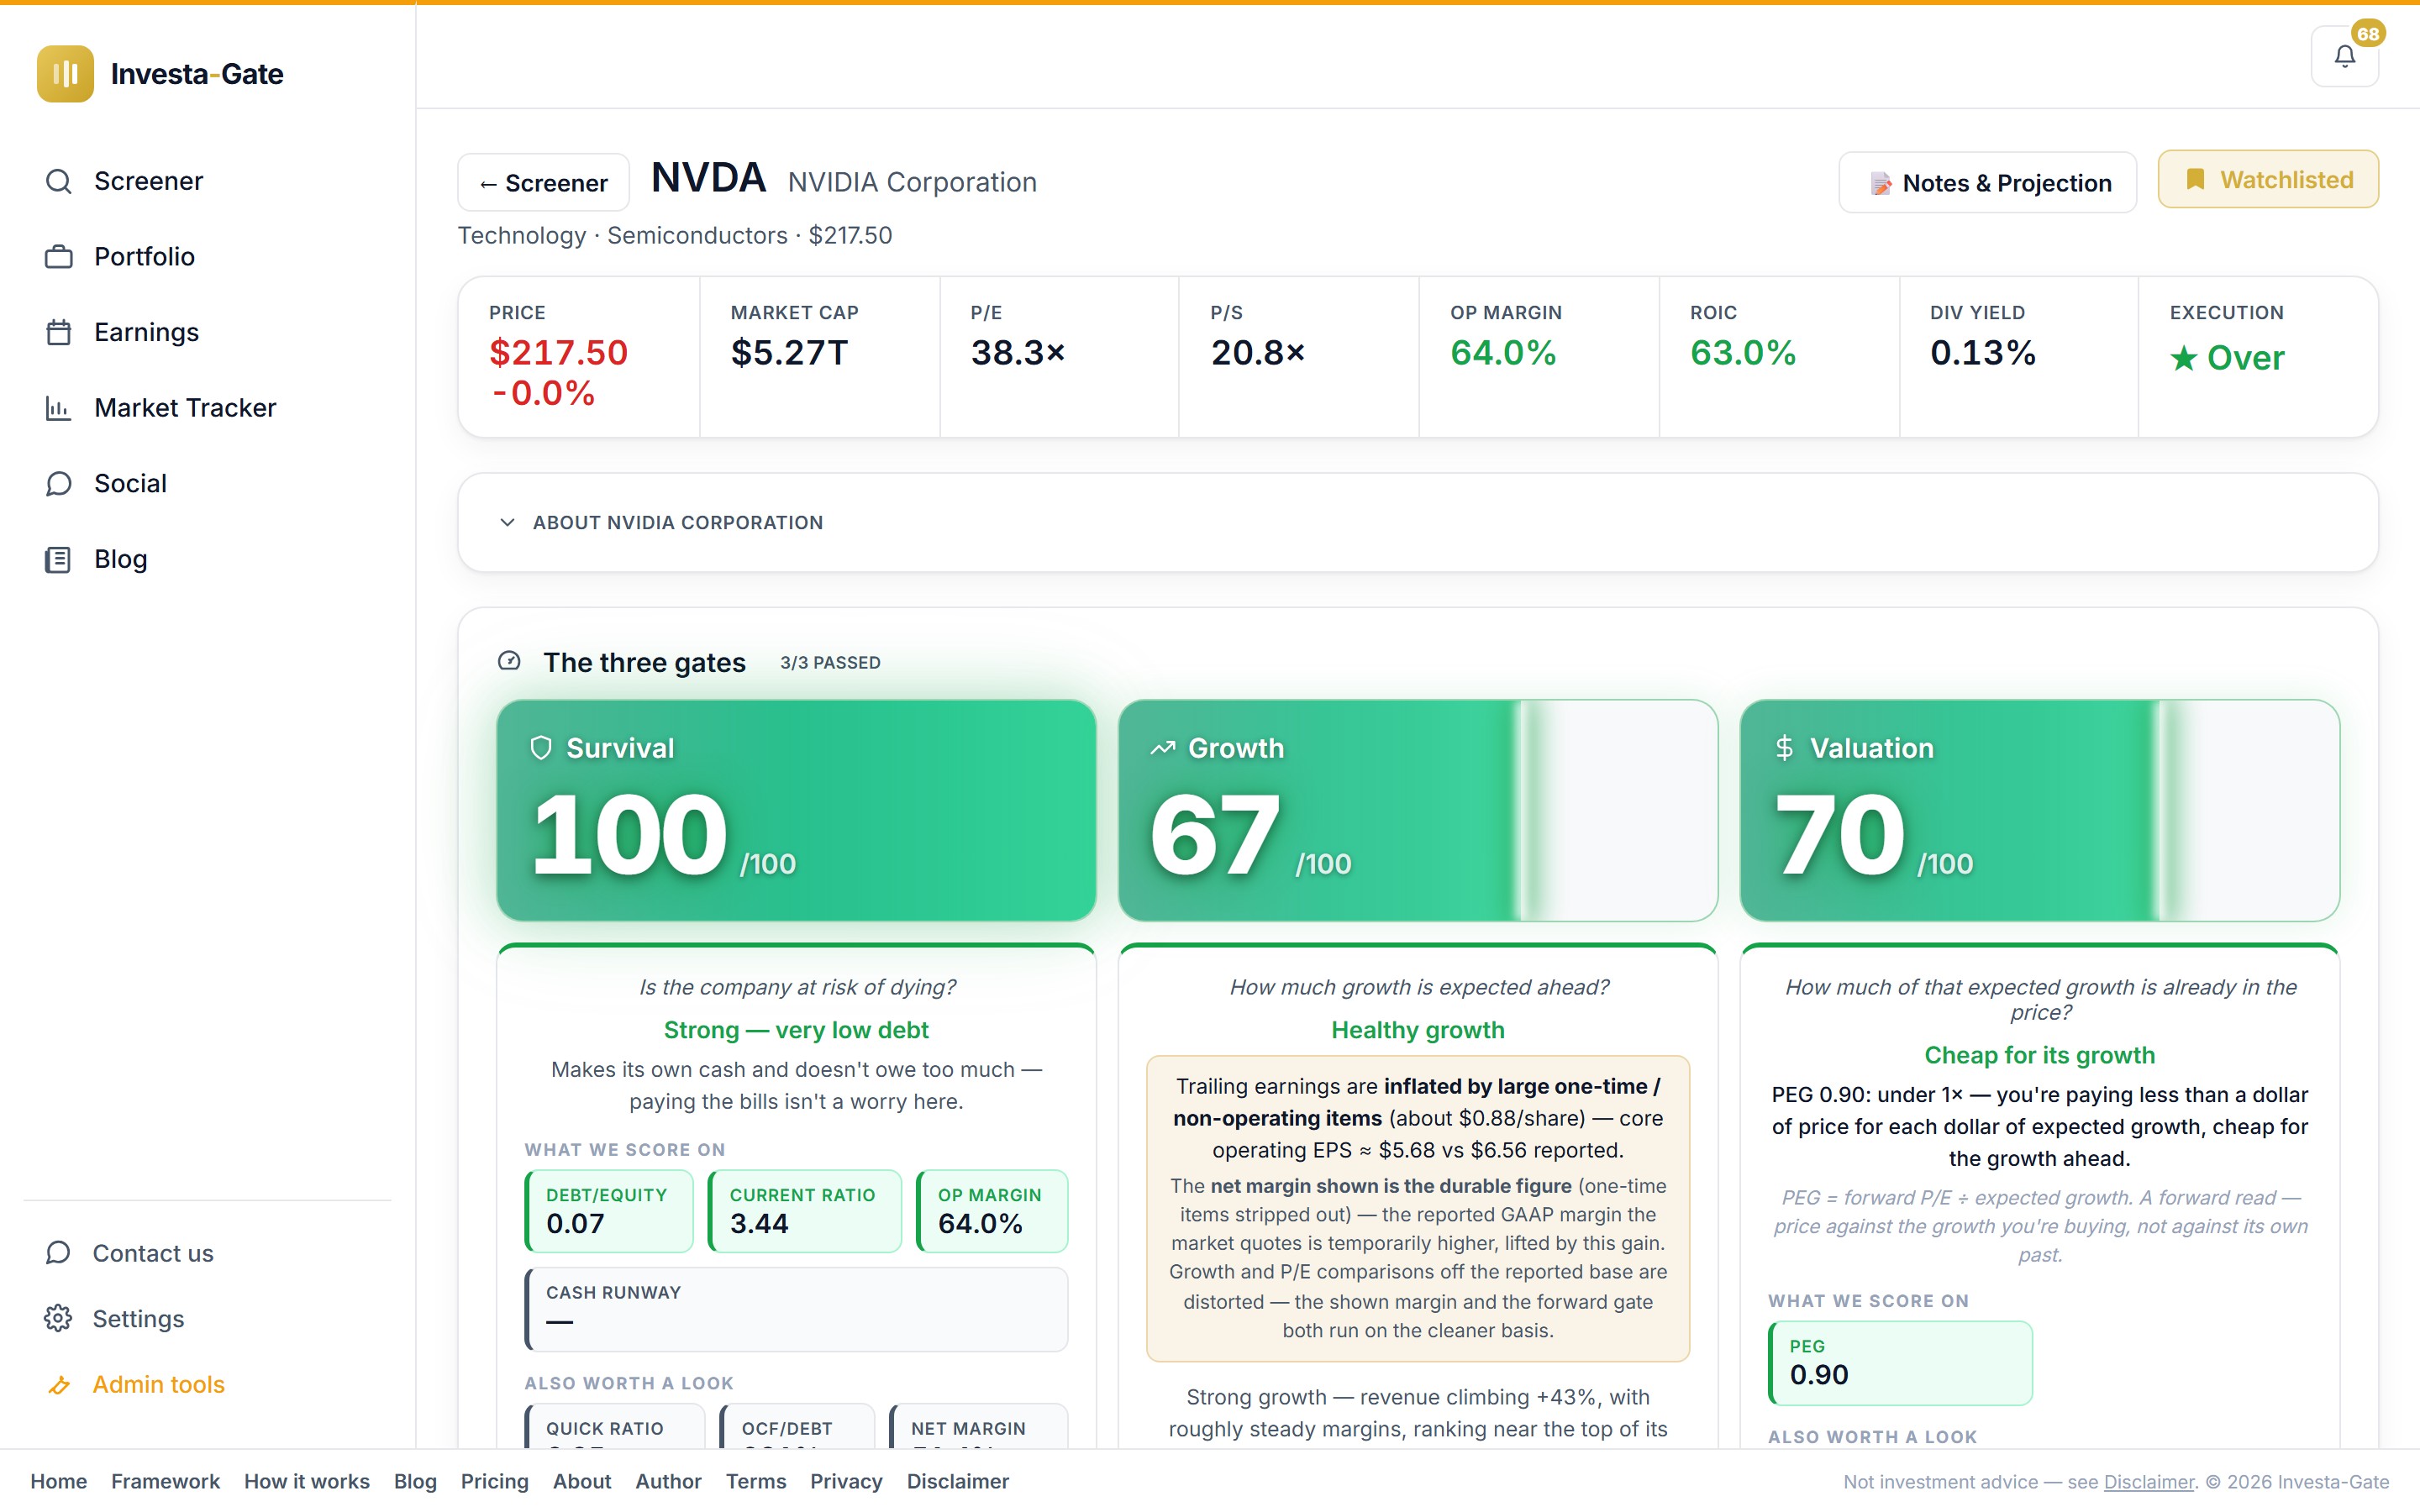
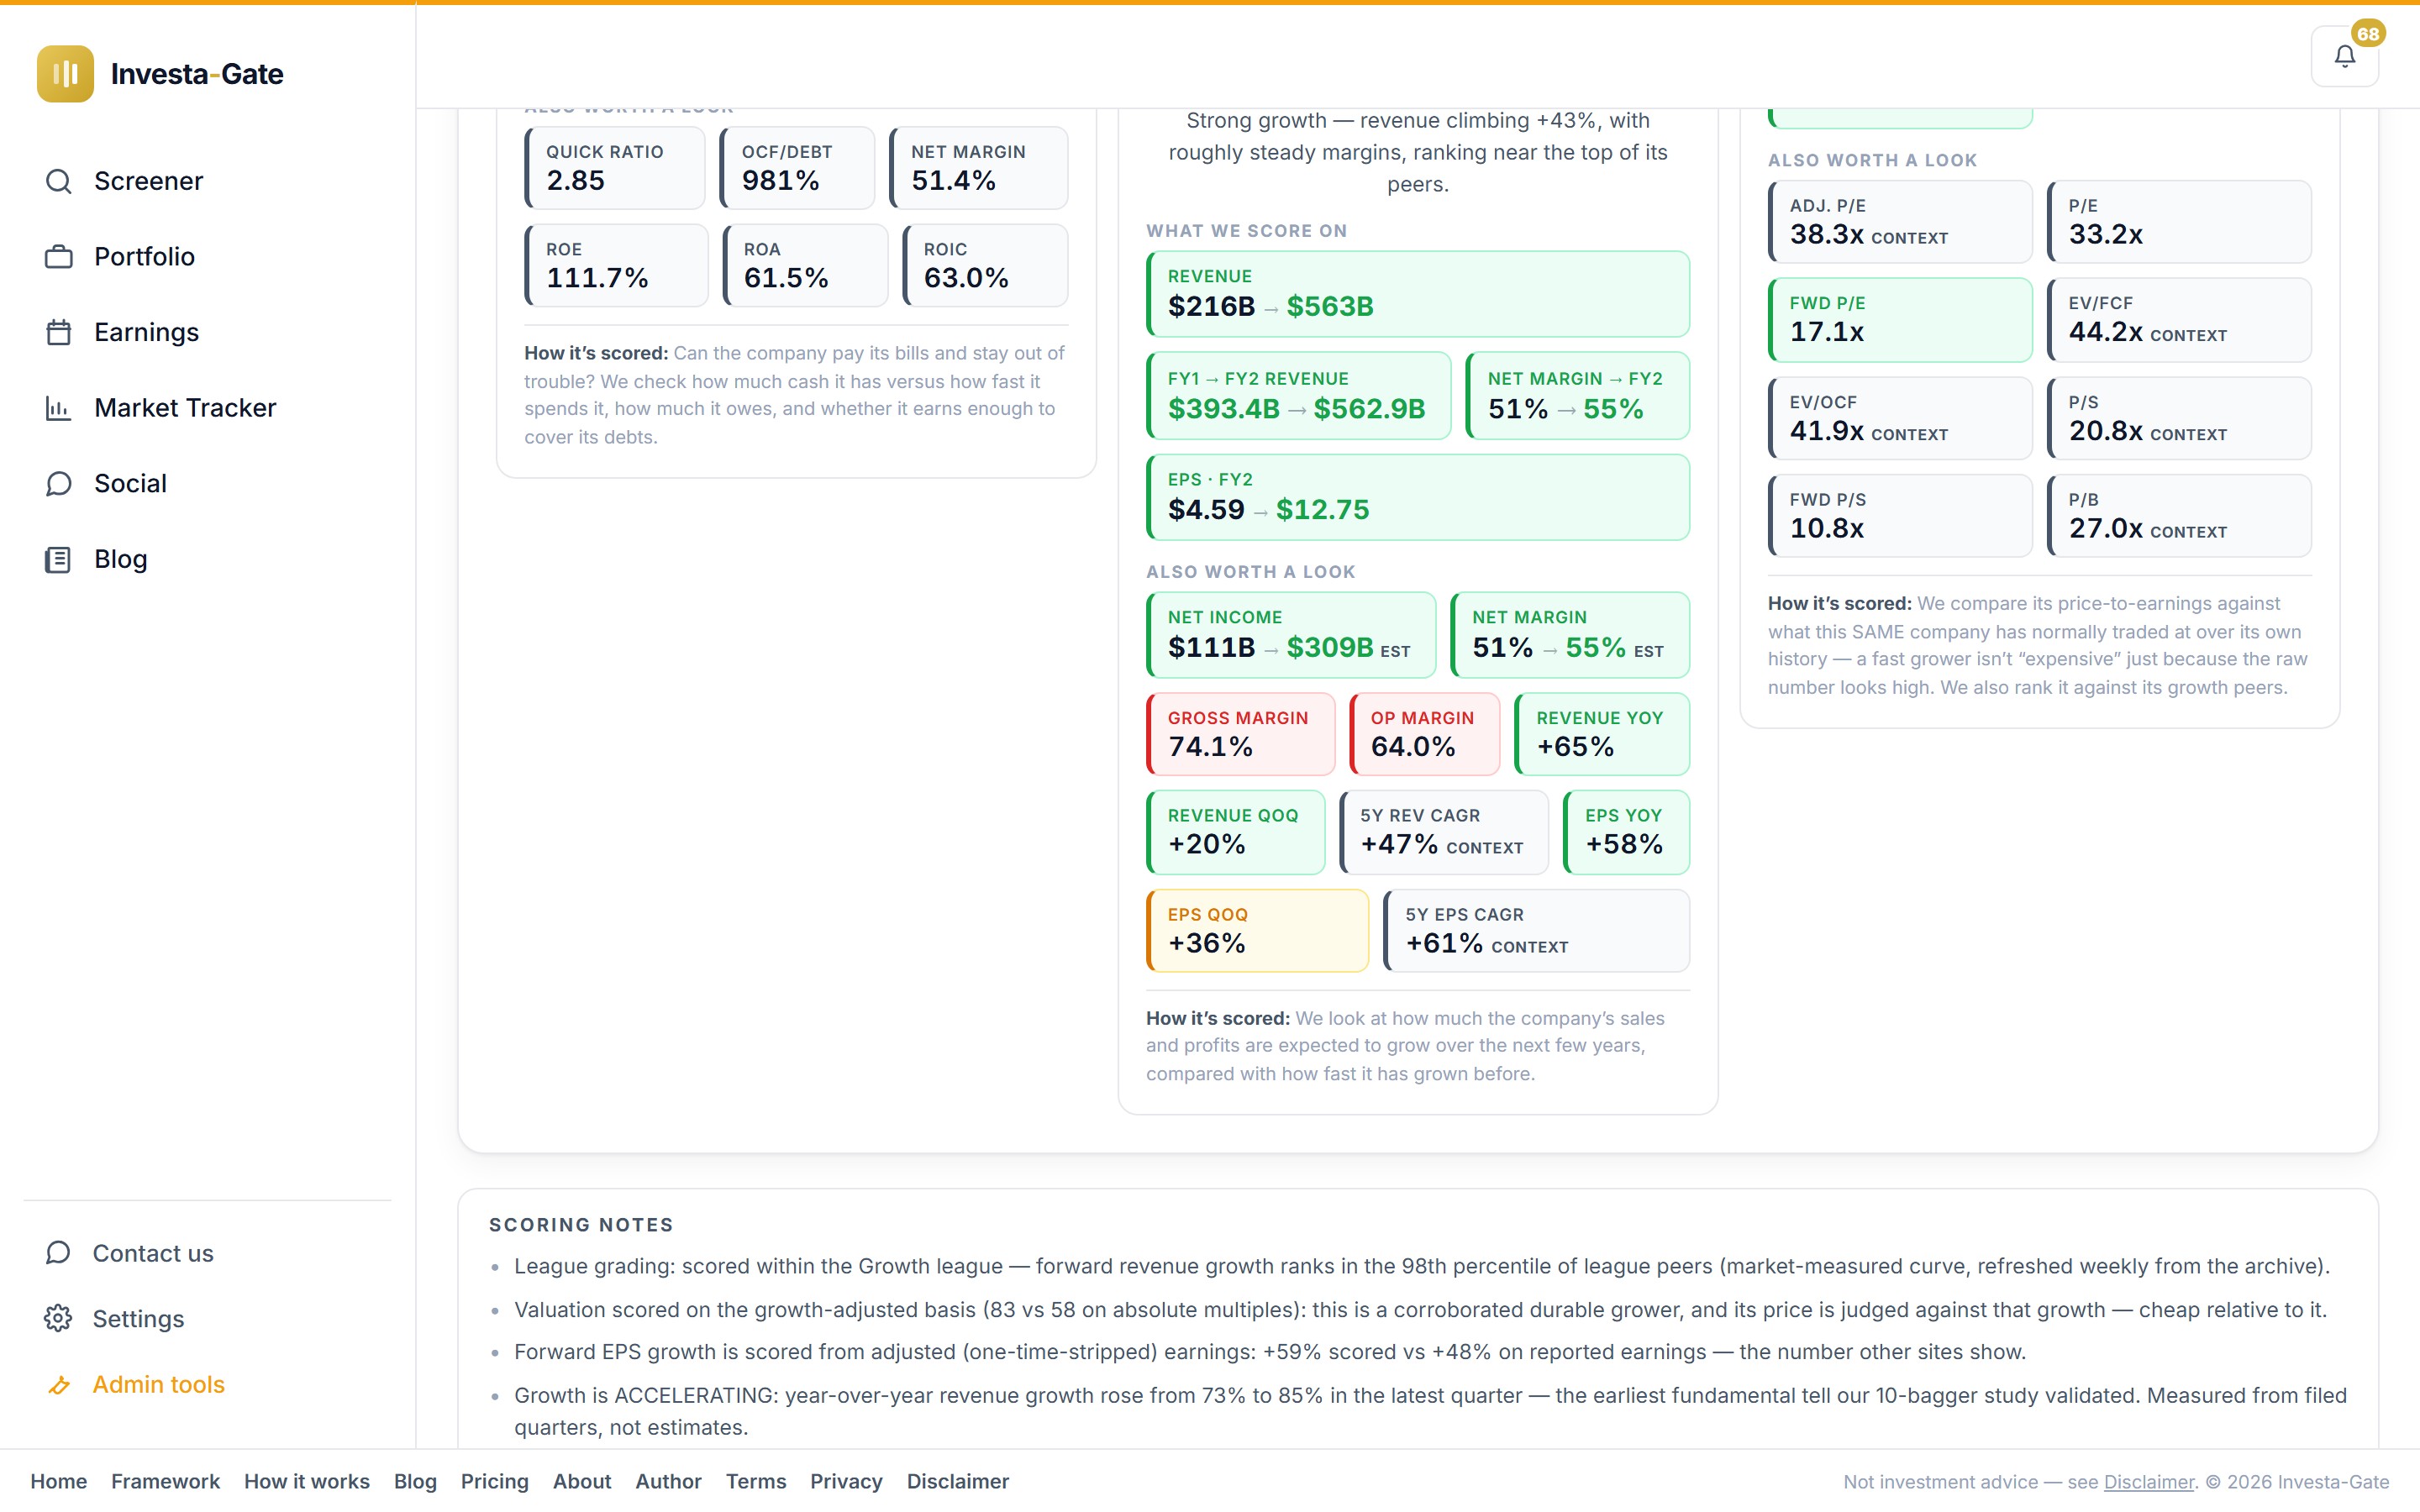
Open any ticker: the three gates, then the numbers behind them

Each stock gets a full data page — the Survival, Growth, and Valuation scores up top, then the financials they’re built on: revenue, earnings, margins, cash flow, and valuation history, all charted. Every score is legible — you can see exactly which metrics moved it and check them against the filing.
Ticker page — screen 1 of 3Ticker page — screen 2 of 3Ticker page — screen 3 of 3
Market Tracker

See where the market’s money is actually going

Eleven sectors and twenty industries, each colored by its real spread vs the S&P 500 across 1-month to 1-year windows. Anomalies to investigate — not headlines to react to.

Market Tracker — screen 1 of 2Market Tracker — screen 2 of 2
Earnings calendar

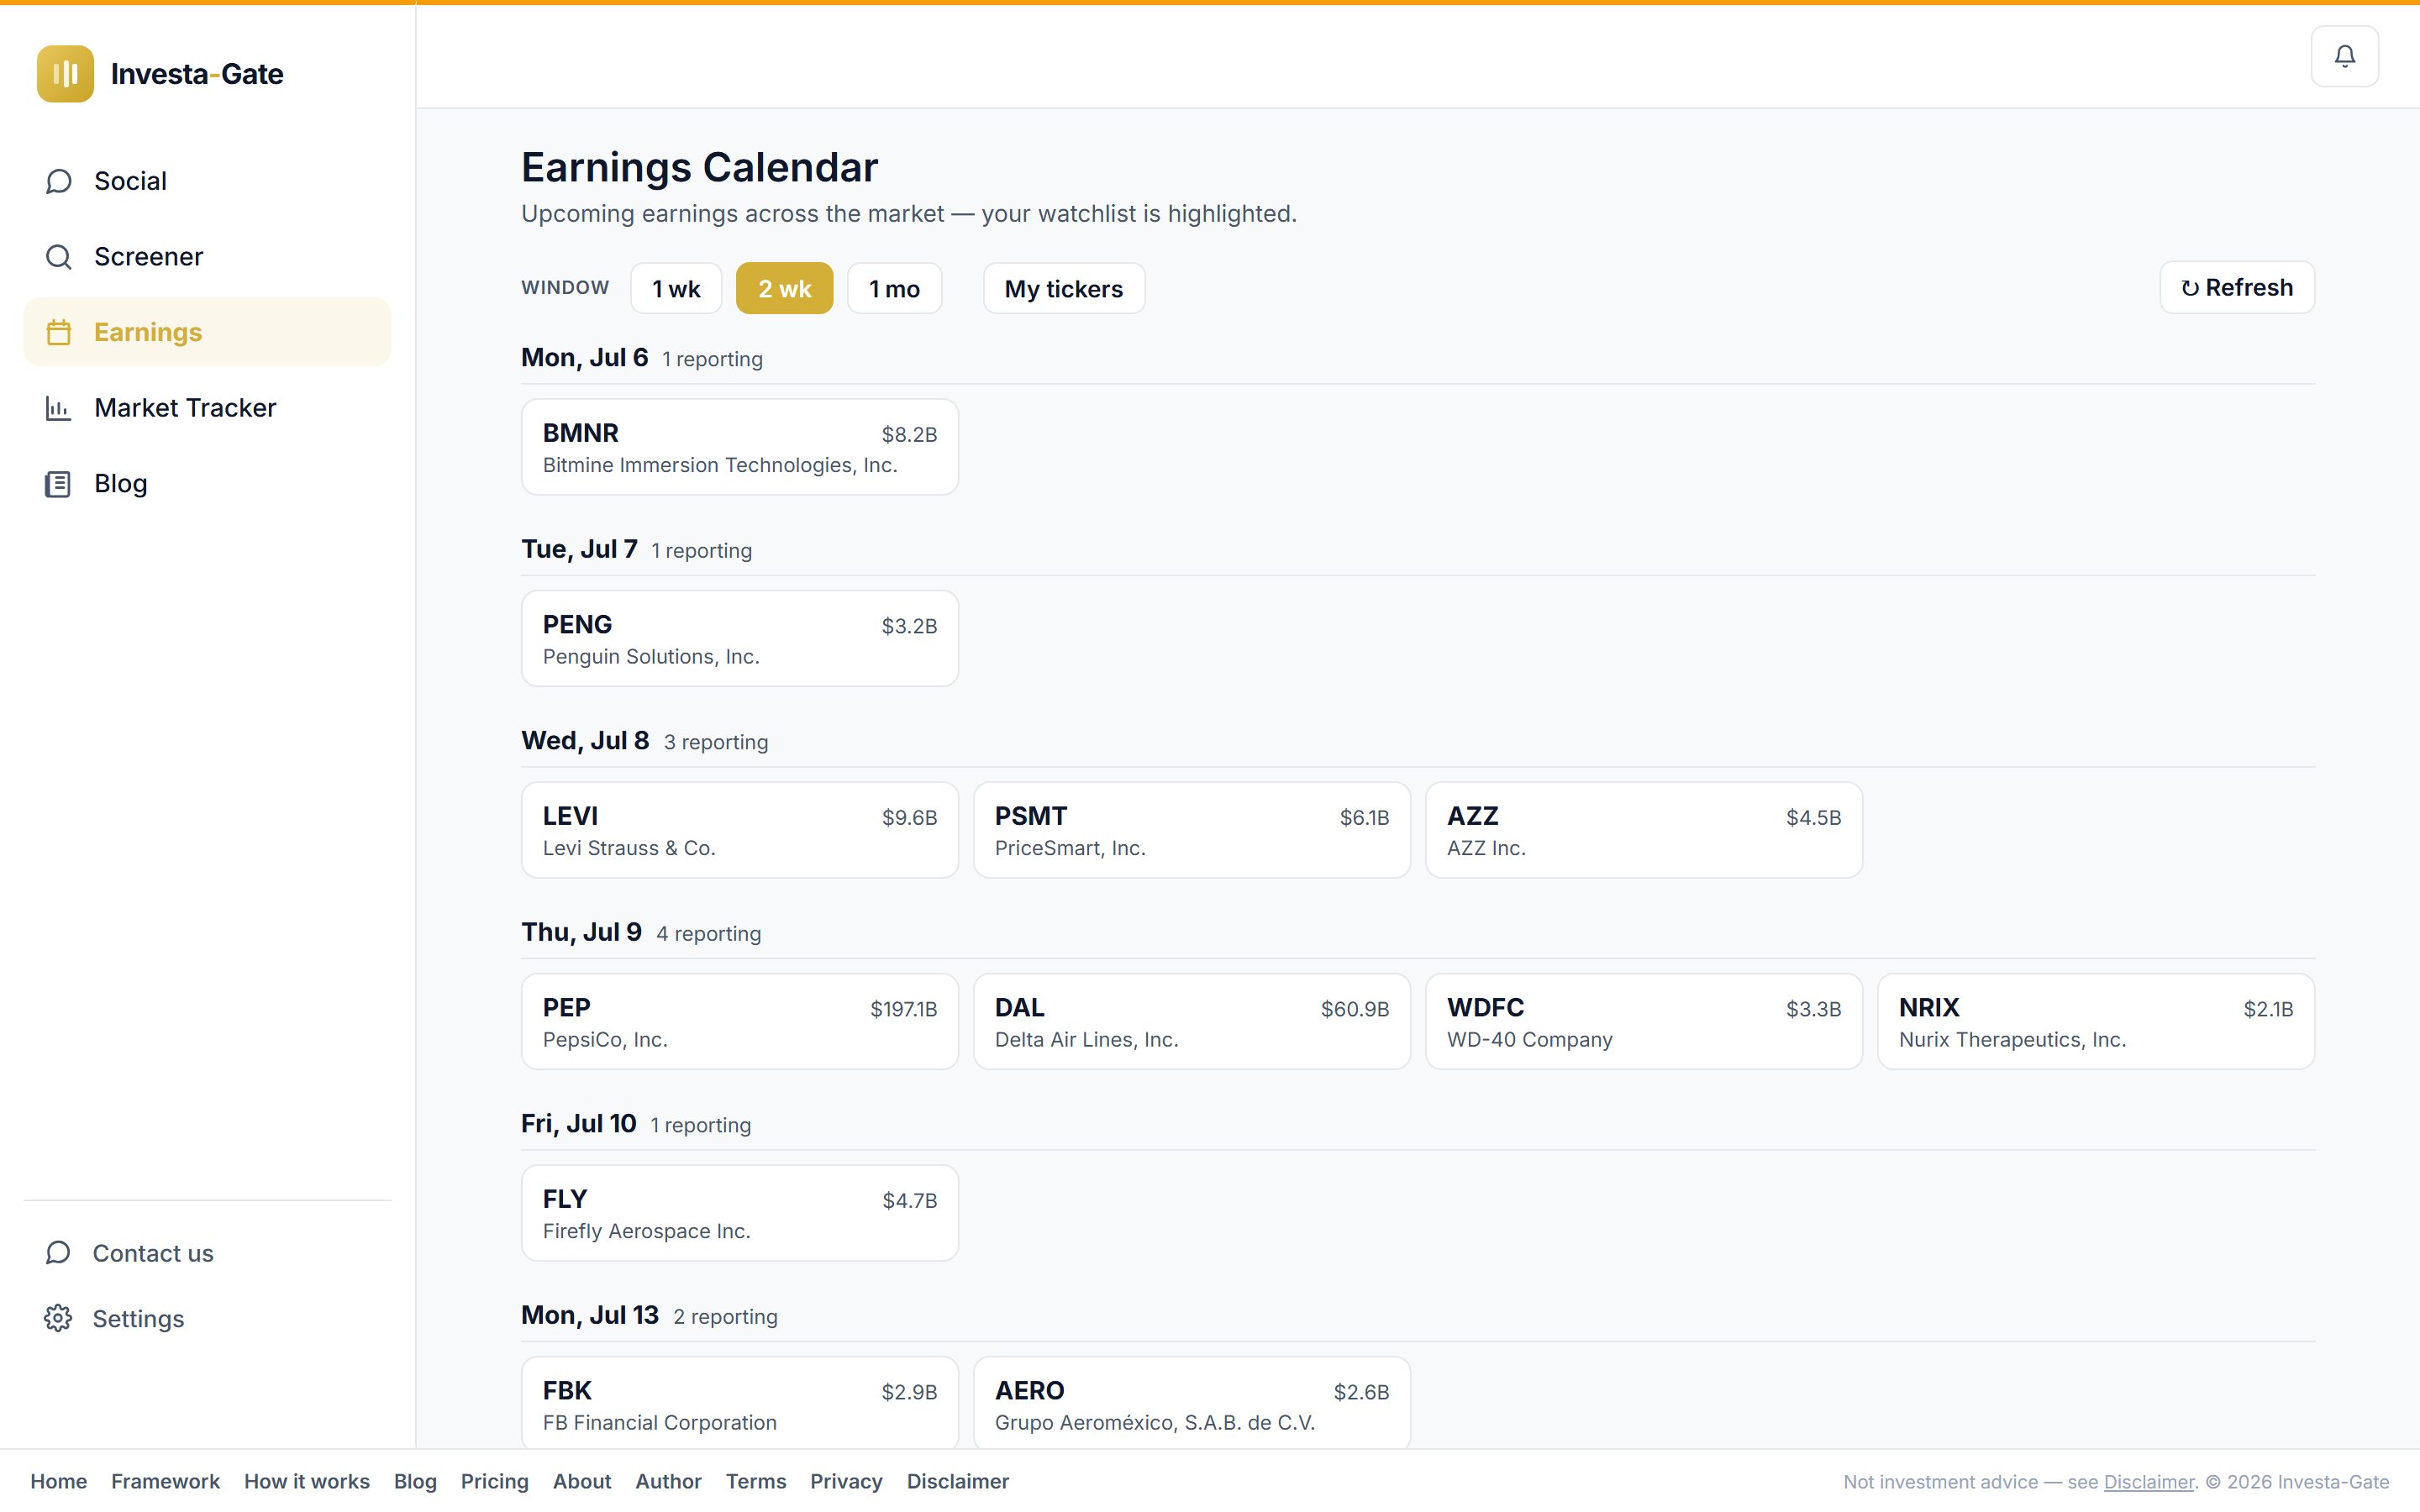
Never get blindsided by a report again

The week’s earnings, with your watchlisted tickers highlighted — and a notification on the bell when one of yours reports within seven days.
Earnings calendar — screen 1 of 2Earnings calendar — screen 2 of 2
Social

Takes with receipts

Share calls, tag tickers, build a tracked public record. Ranking favors the quality of the take, not the size of the following.

Social — screen 1 of 1

How it works

Three steps from ticker to a read — exactly what the tour above shows: Survival, Growth, and Valuation, each scored 0-100 from the fundamentals.

🔍
Step 1

Pick a ticker

Type a symbol or browse the screener. Works on any US-listed common stock or ADR.

⚖️
Step 2

We grade it against three gates

First we sort it into a league — income, growth, or venture — then score Survival, Growth, and Valuation against the benchmarks that fit. Growth looks forward; valuation times the entry. From filed financials, not sentiment.

Step 3

Three scores, 0-100

Survival, Growth, and Valuation — each with the exact metrics behind it, and the full financials one click away.

What most tools don't surface

Four things behind every score.

Track record

Every score, logged forward — publicly

We snapshot our score on every stock each week and measure what actually happened next, against the S&P 500, on a public track record that only moves forward. No backtests, no cherry-picking.

The numbers

Every score traces to the filing

Open a ticker and the full financials sit right there — revenue, earnings, margins, cash flow, and valuation history, charted — so you can check the numbers behind the score.

Integrity

Earnings adjustments built into the score

GAAP EPS gets adjusted for one-off items so growth and valuation scores reflect operating reality, not accounting noise.

Built to fit

League- and sector-tuned scoring

Every stock is judged as what it is — a dividend payer on the safety of its payout, a venture on its traction — and against sector-calibrated thresholds. A 5% return on assets is good on a refiner; on a software company it isn't.

Pricing

One membership, two ways to pay. Everything included.

$20/mo

or $200/year — 2 months free

  • The three-gate score on every US stock
  • Full financials + valuation history on any ticker
  • Screener, market tracker & earnings calendar
  • Cancel anytime
Join monthly — $20 Join yearly — $200 (save $40)

See a sample free. Membership is $20/month.

Membership is $20/mo — the three-gate score on every US stock, the screener, the market tracker, and the earnings calendar. Start with the free sample above.

Create a free account